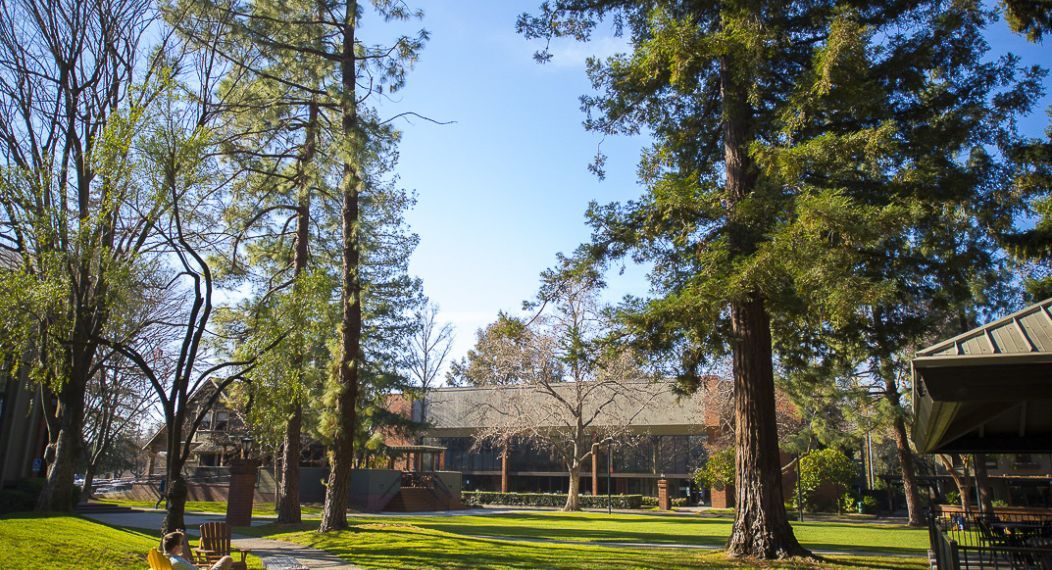
Who are McGeorge students? Highly intelligent, hardworking and fun-loving people like you! Our student body is increasingly diverse and engaged, bringing to the McGeorge community a host of perspectives and talents from a variety of undergraduate programs and careers from around the globe.
Fall 2025 Class Profile1
Combined | Full-time | Part-time | |
|---|---|---|---|
| Applications | 1,275 | 1,121 | 154 |
| Accepted | 678 | 600 | 78 |
| Class Size | 212 | 170 | 42 |
| Age Range | 19-58 | 19-57 | 21-58 |
| Median Age | 24 | 24 | 28 |
| GPA | Combined | Full-time | Part-time |
|---|---|---|---|
| 75th Percentile | 3.73 | 3.74 | 3.58 |
| Median | 3.52 | 3.57 | 3.37 |
| 25th Percentile | 3.19 | 3.25 | 2.89 |
| LSAT | Combined | Full-time | Part-time |
|---|---|---|---|
| 75th Percentile | 160 | 160 | 158 |
| Median | 156 | 157 | 154 |
| 25th Percentile | 153 | 153 | 151 |
| Demographics of Class | Combined |
|---|---|
| Ethnic/Racial Diversity | 56% |
| Women | 59% |
| First Generation | 38% |
| LGBTQ+ | 22% |
| Military | 3% |
| Geographic Diversity | 7.5% |
| Undergraduate Institutions | 88 |
| U.S. States Represented | 11 |
| Foreign Countries Represented | 1 |
1 Note: Data as of Aug. 18, 2025
Questions?
McGeorge Admissions
Email | 916.739.7105


